Materials:
For each student:
work sheets suitable to collect data.
For each team:
personal computer; software (Seisgram2K and files of seismic waveforms; Google Earth Pro)
Educational purpose
The seismogram or waveform of an earthquake can be investigated in more or less depth in relation to one's skills. High school students are provided with basic scientific skills useful for analyzing a seismogram in both a qualitative and quantitative way and obtaining various interesting information. In particular, this scenario intends to enable the participants to recognize the first arrivals of the different types of seismic waves on the seismogram, and to use additional analysis tools useful, in particular, to determine the distance between the epicentre of an earthquake and the station seismic recording the event.
The scenario also offers participants some notions of spherical geometry in particular relating to the shortest route that connects two points on the earth's surface (orthodromic).
The localization of the epicentre of an earthquake is carried out by means of the so called three circles method (triangulation). Once the distances between at least three seismic stations and the epicentre have been calculated, starting from the differences in time of the first arrivals of the P and S waves to the station, three circles, whose diameter is proportional to the related epicentral distances, are traced on a topographic map. The epicentre is located in the point where all three circles intersect. Once the students have grasped the idea that the distance between the epicentre of an earthquake and a seismic station can be calculated starting from the related seismograph, the explainer will train them by the use of Google Earth Pro. This application offers the function “circle” on the menu “ruler” from the toolbar. The function “circle” allows drawing on a world map circles whose radiuses are variable. So, the students can be invited first to set three mark points on the earth’s surface and then three circles having the mark points as centres. Therefore, the students will verify that the three circles can reciprocally touch each other in just one point, depending on the chosen radiuses.
Cross-cutting objectives:
This item describes cross-cutting information and skills the beneficiaries could acquire attending the activity
In addition to understanding the physical meaning of a seismogram and the information that can be derived from it, this scenario cross-cuts numerous others subjects ranging from physics and the study of mechanical waves in particular, to earth sciences and cartography.
Previous knowledge of the participants:
• ability to interpret a space / time graph;
• ability to use user friendly softwares on a PC;
• general notions of physics (mechanical waves) and earth sciences.
Proceedings, description:
To locate the epicentre of an earthquake, usually researchers apply this method recurring to recordings gathered by seismic stations seated close to the epicentre to get a more accurate localization. Moreover, in these contexts the localization doesn’t feature just the calculation of the difference in time between the arrivals of P and S waves and the solving of an equation, but it also implies complicated corrections depending on the depth where the events has been triggered, the local geology and therefore the mechanical features of the rocks passed through by the waves. These factors should be well known by the researchers studying an earthquake. Instead our activity entails the use of recordings gathered by seismic stations seated very far (thousands of kilometres) from the epicentre. In this way, the effect of local geology as well as the occurring errors in distance is negligible if compared with the distances between the epicentre and the seismic stations. The use of such kind of software application like Google Earth Pro allows us to mark circles having as radiuses directly the great circle route due to the round shape of the Earth. Students will be divided into groups of two or three people. Each group will be equipped with a PC. The explainer will have previously installed on each PC the software and files necessary to localise the epicentre of an earthquake: Seisgram2K to analyze the seismograms; Google Earth Pro to localize the epicentre.
On the desktop of each PC each group will find a directory containing the seismogram of a significant earthquake recorded by a seismic station chosen by the explainer and gathered by the EIDA database of the Orfeus web site (145.23.252.222/ eida/webdc3/), and a file giving some information about the seismic station such as geographical coordinates and altitude. Each directory can be named with the acronyms officially identifying the seismic station.
For example, in this script it has been chosen an earthquake occurred on October 26th 2015 in the north-eastern Afghanistan. This earthquake has been chosen because of its high Magnitude (7.5) and therefore seismographs all around the world recorded it and because it has been triggered very deep (over 200 km) and therefore the first arrivals of P and S waves are clearly visible on the waveforms.
Three seismic stations have been chosen (table 1) seated respectively in southern Italy1 , Japan and in Maldives’ islands.
| Seismic station | Network | Location | Latitude | Longitude |
| KAAM | GE (Deutsches GeoForschungsZentrum) | Madaveli, Maldives | 0,4926° N | 72,9949° E |
| INU | G (Geoscope – IPGP) | Inuyama, Japan | 35,35° N | 137,029° E |
| COL3 | IX (AMRA) | Colfiorito, Colliano, Italy | 40,6871° N | 15,3304° E |
Students compare the data they collected during the previous phase with their concept map (initial ideas). They can add/delete/adjust (with a different color) what they have learnt and present it to the classroom (they can also do the same thing after they listen to all the teams or you can have a classroom concept map and teams can add to that). The stations have been chosen because of their position and their distance which is relative to the epicentre of the earthquake. For such kind of earthquakes an effective distance could be in a range between 2000 and 6000 km.
Then, the explainer will ask the student to open the file of the seismographs they got by using Seisgram2k. On each of the three recordings the students should easily recognise the first arrivals of P and S waves considering the pictures of seismograms showed by the explainer at the very beginning of the lesson.
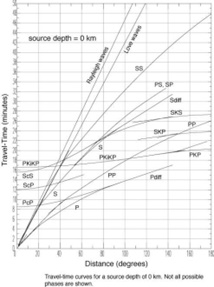
The table of Jeffrey & Bullen (left) reports on y-axis the arrival times of different kinds of seismic waves depending on the distance from the epicentre (x-axis) expressed in degrees (°)
So, the explainer will ask the students to determinate the difference of time between the first arrival of P and S waves by using the available function “pick”. Once they will have gathered this difference in time they will be invited to determinate the distance between their “own” station and the epicentre first by using the printed table of Jeffrey & Bullen (see figure 3) and a ruler.
Then they will do the same exploiting the function “Hodrochrone-Tele” of Seisgram2K 2
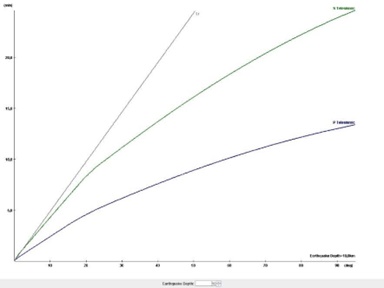
The hodochrone changes the shape of its trend in relationship with the hypocentral depth. The students couldn’t previously know the depth but the teacher could remind them the pictures showed at the beginning of the lesson and suggest setting up a depth of 150 - 200 km.
In both cases the distance they will get will be expressed in degrees (°). The web site http://www.spigolo.altervista.org/ortho/OrthoFirstProblem.html could effectively illustrate to the participants the meaning of a distance expressed in degrees and the corresponding orthodromic rout on Earth’s surface, both in numerical and graphical way.
Anyway, the value of a degree on Earth surface is around 111 km, so the students must multiply the gathered value in degree by 111 km to get the distance in kilometres.
Conclusion phase
Once each group has calculated the distance between their own station and the epicentre, they will share this information with the geographical coordinates of their own stations. To make the activity more interactive, the groups will be named by the teacher with the names of the seismic station they are representing. So during the sharing of information the groups will interact as real international groups of researchers.
Below, the epicentral distances of the three seismic stations determined by means of the window “Hodochrone-Tele” of Seisgram2K knowing the difference in time of the first arrivals of P and S waves (TS – TP). Considering the shape of the seismograms, in the window it was set up a depth of 200 km
| Seismic station | TS - TP (s) | Distance (°) | Distance (km) |
| KAAM | 325,7 | 36,2° | 4018 |
| INU | 433,6 | 52,9° | 5872 |
| COL3 | 379,9 | 44,4° | 4928 |
The location of the epicentre will be determined in a graphical way using Google Earth Pro. First, each group will place on the 3D World map some “placemarks” corresponding to the seismic stations whose geographical coordinates will be already known by the students. Once the placemarks are placed, by using the function “circle” of the menu “ruler” of the toolbar, they will draw three circles having the centres corresponding to the seismic stations placemarks and radiuses scaled to the epicentral distances. The epicentre is located in the point where all three circles intersect. As already said, the radiuses of the circles traced on Google Earth Pro are not conceived as straight lines but as circle routes on round surfaces, so the method can work also for distances thousands of kilometres long.
As a feedback to evaluate if the procedure was performed right, the teacher will show to the students the web page related to the earthquake in question on the Significant Earthquakes Archive of USGS (http://earthquake.usgs.gov/earth-quakes/browse/significant.php) where there is a researches report of the geographical coordinates of the event. So, the students will put on the Wold map a new placemark having these coordinates to verify if they are situated into the area described by the intersected circles.
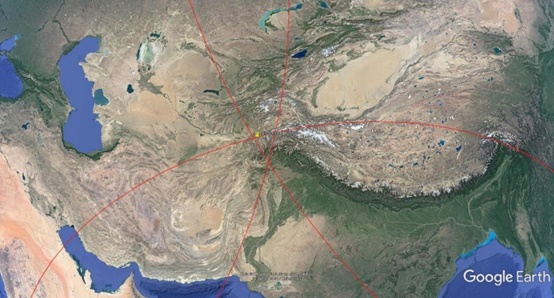
The placemark showing the epicentre of the earthquake seated inside the spherical triangle made by the intersection of the three circles. The geographical coordinates of the epicentre the have been provided by USGS bulletin.